
The Core Strategy
The RB1 Strategy
Free previewA pre-confirmation reversal strategy that enters at major weekly/daily levels the moment a trend runs out of fuel, before the rest of the market notices. Built on a four-timeframe stack, the 50 EMA, volume timing, and a non-negotiable 2:1.

What RB1 is
RB1 stands for Reversal Breakout 1 (you may also see it referred to by its older name, Advanced Breakout / ABO). It's a setup for catching a market right as a trend runs out of steam at a major level and turns the other way.
The thing that makes RB1 different from most reversal trading is when you enter. Most retail traders wait until a reversal is obvious, until the new trend is printing clean higher highs or lower lows that anyone can see. That feels safe, but by then the move has already travelled. You're entering late, your stop has to sit further away, and your reward-to-risk has quietly collapsed.
RB1 does the opposite. You enter as the old trend decelerates, at the absolute extreme of the exhaustion, before confirmation arrives. That's where the entry is cheapest and the stop is tightest, which is exactly what lets the strategy hit its required 2:1. It also demands more discipline and precision than a confirmation entry, which is the whole point of trading it well.
The one sentence to remember: You are not trading an established trend. You are trading the deceleration of the trend that's already there.
The core principle: trade deceleration, not confirmation
When price drives into a major historical level, it runs into the institutional liquidity sitting there. The trend doesn't stop instantly. It decelerates. The candles get smaller, momentum fades, and the move starts to coil. RB1 is built to identify that exact moment of fade and enter at the extreme of it.
This is why waiting for late confirmation kills the trade. The most common version of this mistake is waiting for price to break and close beyond the 1-hour 50 EMA before entering. By the time the 1H 50 EMA is broken, the first explosive leg off the level has already happened. Your entry is now far worse, and the 2:1 is gone.
So the rule is blunt: you trade through the 1H 50 EMA, you do not wait for it to break. Treat a "wait for the 1H EMA" instinct as a warning sign that you're about to enter late.
The four-timeframe stack
RB1 is a top-down strategy. Each timeframe has one specific job, and they are not interchangeable. Every layer has to give its green light before a trade is valid. Think of them as interlocking gears.
| Timeframe | Its single job |
|---|---|
| Daily / Weekly | Set the bias and mark the major historical support/resistance. Price must be reacting to one of these macro levels. No major level = no trade. |
| 4-Hour | Measure overextension and "room to run." The 4H 50 EMA is your target: there must be enough distance to it to justify a 2:1. |
| 1-Hour | Spot the deceleration pattern: the wedge or triangle showing the trend is failing against the macro level. |
| 5-Minute | The execution trigger. A strong candle closing beyond the 5M 50 EMA, right as the 1H pattern breaks, is your entry. |
When the timeframes seem to disagree
You will constantly see this: the 4-hour still looks strongly bullish while the 1-hour is curling into something bearish. New traders freeze here, thinking they've found a contradiction. They haven't. That conflict is the setup. RB1 relies on the 1H decelerating while the 4H is still overextended. The higher timeframes give you the boundary and the destination; the lower timeframes give you the vehicle to get in. Let the 5-minute trigger resolve the tension.
The 5-step setup (in order, never reorder)
These five phases are strictly chronological. Skip one or run them out of sequence and the mathematical edge is gone.
Phase 1: Find the macro level. Start on the Daily or Weekly. Look for assets pressing into a major, historically validated support or resistance zone. If price is floating in the middle of nowhere between zones, discard it. RB1 trades only originate at a major structural wall.
Phase 2: Find the deceleration pattern on the 1H. Once price is interacting with that level, drop to the 1-hour and look for the trend visibly losing energy:
- Rising wedge: higher highs, but compressing candles into resistance → sets up a short.
- Falling wedge: lower lows, but flattening momentum into support → sets up a long.
- Triangle: volatility coiling tightly against the level before an explosive move the other way.
Draw the trendlines so they capture the bulk of the price action. The pattern is your visual proof that the market is trying and failing to push through the macro level.
Phase 3: Check "room to run" on the 4H. Measure the distance from your proposed entry to the 4H 50 EMA. That gap is your profit. The rule is non-negotiable: it must be wide enough that taking profit at the 4H 50 EMA gives you at least 2:1 after accounting for your stop. If the market has already reverted and the distance is too small, abandon the trade, no matter how beautiful the 1H wedge looks.
Phase 4: Confirm volume and session. Patterns are inert without fuel. Enter into the London or New York session open, when institutional capital floods in and creates the volume spike that actually shatters the 1H pattern. Volume is the catalyst that validates the geometry.
Phase 5: Take the 5-minute trigger. Watch the 1H pattern start to fracture, then execute on a strong, impulsive 5-minute candle closing beyond the 5M 50 EMA: below it for shorts, above it for longs. Enter immediately on that close. This is what puts you in at the extreme high or low and preserves your reward-to-risk.
The indicators
RB1 runs a deliberately minimal toolkit. A clean chart beats a cluttered one.
The 50 EMA: one line, three different jobs
The 50 EMA sits on all four timeframes, but it means something different on each. Do not mix these up:
| Timeframe | Role of the 50 EMA |
|---|---|
| 4H | The magnetic target. When price stretches far from it, the market is overextended and the EMA pulls price back. This is your primary profit target on pullback plays. |
| 1H | The trend filter, and the trap. It defines the angle of the deceleration. You trade through it. Waiting for it to break is too late. |
| 5M | The execution trigger. A strong volume candle closing beyond it is your green light to fire. |
The classic beginner errors are using the 4H EMA as an entry or the 5M EMA as a target. Keep each one in its lane.
MACD divergence: the fingerprint of exhaustion
The 1H wedges show you the structure; MACD shows you the hidden momentum underneath. Don't use it for crossovers, use it for divergence:
- Bearish divergence: price makes a higher high into resistance, but MACD makes a lower high → buying momentum is dying → validates a rising wedge.
- Bullish divergence: price makes a lower low into support, but MACD makes a higher low → selling pressure is evaporating → validates a falling wedge.
Divergence is a leading signal. It tells you the trend is decelerating even while price is still pushing into new extremes.
Fibonacci: for targets and macro context
- 38.2%: when it lines up with the 4H 50 EMA, you get a high-confluence exit zone. This is the optimal take-profit on standard pullback plays.
- 61.8%: marks the completion of an Elliott Wave 5 run. A reversal at a 61.8% level is a major, high-probability turning point, the origin of the big macro RB1 setups.
- Extensions (1.0 and 1.75): used to project targets on large trend plays, far beyond the moving averages.
Two flavours of RB1: pullbacks vs. trends
This is the distinction that separates intermediate traders from advanced ones. Not every RB1 is the same trade, and mixing their rules is how you either cut a monster run short or let a clean winner round-trip into a loss.
Pullback plays are the common version: counter-trend moves inside a bigger established trend (Elliott Wave 2 or 4 corrections). The market is briefly overextended and reverting to the mean before the primary trend resumes. These are quick in-and-out trades. Target the 4H 50 EMA and take profit there, mechanically. Because the bigger trend is against you, the 4H 50 EMA often acts as a hard wall and the original trend resumes violently off it. Don't get greedy.
Trend plays are the rare, high-yield version: they happen when the major Daily/Weekly level is an actual structural top or bottom, kicking off a brand-new macro trend (Wave 1, 3, or 5). Here you do the opposite: hold through the 4H 50 EMA, because the new trend will slice cleanly through it. Targets move much further out, Monthly 50 EMA, macro structural levels, or the 1.75 Fib extension, and you manage the position dynamically, trailing your stop behind structural trendline breaks.
| Pullback play | Trend play | |
|---|---|---|
| Elliott Wave phase | Wave 2 or 4 correction | Wave 1, 3, or 5 run |
| Primary target | The 4H 50 EMA | Monthly 50 EMA, 1.75 Fib extension, macro levels |
| Stop management | Static, just past the pattern high/low | Dynamic trailing, below all foundational structure |
| Nature | Quick; ~2-3% | Multi-day/week holds; 8%+ potential |
| At the 4H 50 EMA | Take full profit, expect the trend to resume against you | Hold through it, expect a clean break |
Volume and session timing
RB1 depends entirely on momentum breaking out of a tight pattern, and momentum needs liquidity. This is why when you trade matters as much as what you trade.
High-volume windows (London and New York opens) are where the strategy works. Institutional capital comes online, you get a clean volume spike, the 1H wedge shatters decisively, and the trade tends to move in your favour immediately, which keeps you out of drawdown and gets you to target fast.
Low-volume periods (the Asian session, mid-day lulls) are toxic to RB1. The strike rate drops to around 50%: effectively a coin flip. Without kinetic energy, price drifts sideways into chop instead of running to the 4H 50 EMA, and thin liquidity produces erratic false spikes, long wicks that grab your tight stop before the real move ever starts.
| Volume environment | Strike rate | Behaviour |
|---|---|---|
| High (London / NY open) | Optimal | Strong momentum, clean breakouts, fast moves to target |
| Low (Asian / mid-day) | ~50% | Sideways chop, false wicks, premature stop-outs |
The discipline here is patience: wait for the physical volume spike to show up alongside the strong 5-minute candle. That dual confirmation means the market is actually ready. (The manual's GBP/CAD example pins the ideal entry to the London open for exactly this reason.)
Risk architecture
The best entry in the world fails over a large sample without ironclad risk rules. On RB1, treat these as laws, not guidelines.
The 2:1 minimum is the whole engine. Every trade aims for at least 2% return per 1% risked. This is what keeps you profitable even through a rough patch: if your strike rate falls to 50%, winning half at +2% and losing half at −1% still grinds your equity curve upward. A setup that only offers 1:1 or 1.5:1 is structurally invalid: skip it.
Stop placement. Put the stop safely beyond the structure that defines your 1H pattern, above the recent highs for shorts, below the recent lows for longs. On trend plays you hold for days, so place it more conservatively, below all the foundational lows (or above all the highs) of the setup.
Don't "choke" the trade. The tempting mistake is tightening your stop right up against entry to manufacture a 3:1 or 4:1. Don't. A stop that tight gets wicked out by normal noise, spread widening, and liquidity grabs before the real reversal begins. A slightly wider stop that gives a secure 2:1 beats a tight one that promises 3:1 and stops you out routinely. The manual's AUD/JPY example uses a realistic ~25-pip stop sitting nicely above the highs, wide enough to absorb spread and liquidity grabs without breaking the math.
Move to breakeven once price clearly breaks the 1H 50 EMA. That break confirms the reversal has legs, so shifting your stop to entry turns it into a risk-free position.
Trade management and psychology
The last hurdle isn't charts, it's you. A flawless 2:1 entry still loses if you can't manage the open position with discipline.
Consistency over home runs. The mechanics can catch 8%+ macro runs, but your baseline mindset has to be the boring, mechanical extraction of profit at predefined targets. Respect the 4H 50 EMA on every pullback play.
Kill the "hope." This is the most common way a good trade becomes a loss: you nail a pullback, price hits the 4H 50 EMA exactly as planned, and then you don't close it, hoping it becomes a giant trend reversal. But the 4H 50 EMA is precisely where the original trend tends to resume violently. Hoping for the 8% turns a perfect, mathematically sound winner into a full loss. Take the exit at target. No hesitation, no negotiation.
Manage trend plays around the news. Because trend plays are held for days, they're exposed to scheduled high-impact news (rate decisions, employment data). That kind of event creates volatility that ignores your technicals and can slip straight through a stop. Trail your stop behind structural trendline breaks, and manually exit before major news to lock in accrued profit.
Worked examples
These are real RB1 executions to study alongside the lesson. Each chart shows the full timeframe stack (Daily → 15m → 4H → 5m → 1H → 2m) with the entry, stop, and targets marked.
- GBP/NZD: short, 1 Jun 2023 (
rb1_gbpnzd_short_2023-06-01.png): rising wedge into a major level. - CAD/JPY: short, 27 Jun 2023 (
rb1_cadjpy_short_2023-06-27.png) - EUR/SGD: short, 28 Jun 2023 (
rb1_eursgd_short_2023-06-28.png) - GBP/USD: long, 19 Sep 2023 (
rb1_gbpusd_long_2023-09-19.png): falling wedge / long setup. - EUR/CHF: long, 7 Dec 2023 (
rb1_eurchf_long_2023-12-07.png) - NZD/CAD: long, 26 Mar 2024 (
rb1_nzdcad_long_2024-03-26.png)
The one-page checklist
- Daily/Weekly: Is price at a major historical level? (No → skip.)
- 1H: Is there a clear deceleration pattern: rising/falling wedge or triangle?
- MACD: Is there divergence confirming momentum is fading?
- 4H: Is there enough room to the 4H 50 EMA for a clean 2:1? (No → skip.)
- Session: Are you at the London or NY open with real volume? (No → wait.)
- 5M: Has a strong candle closed beyond the 5M 50 EMA? → Enter.
- Stop: Just beyond the pattern structure: wide enough to breathe, never choked.
- Target: 4H 50 EMA (pullback) or macro level / 1.75 ext (trend). Decide before you enter.
- Manage: Breakeven on the 1H 50 EMA break; take profit mechanically; exit before high-impact news on holds.
Trade examples
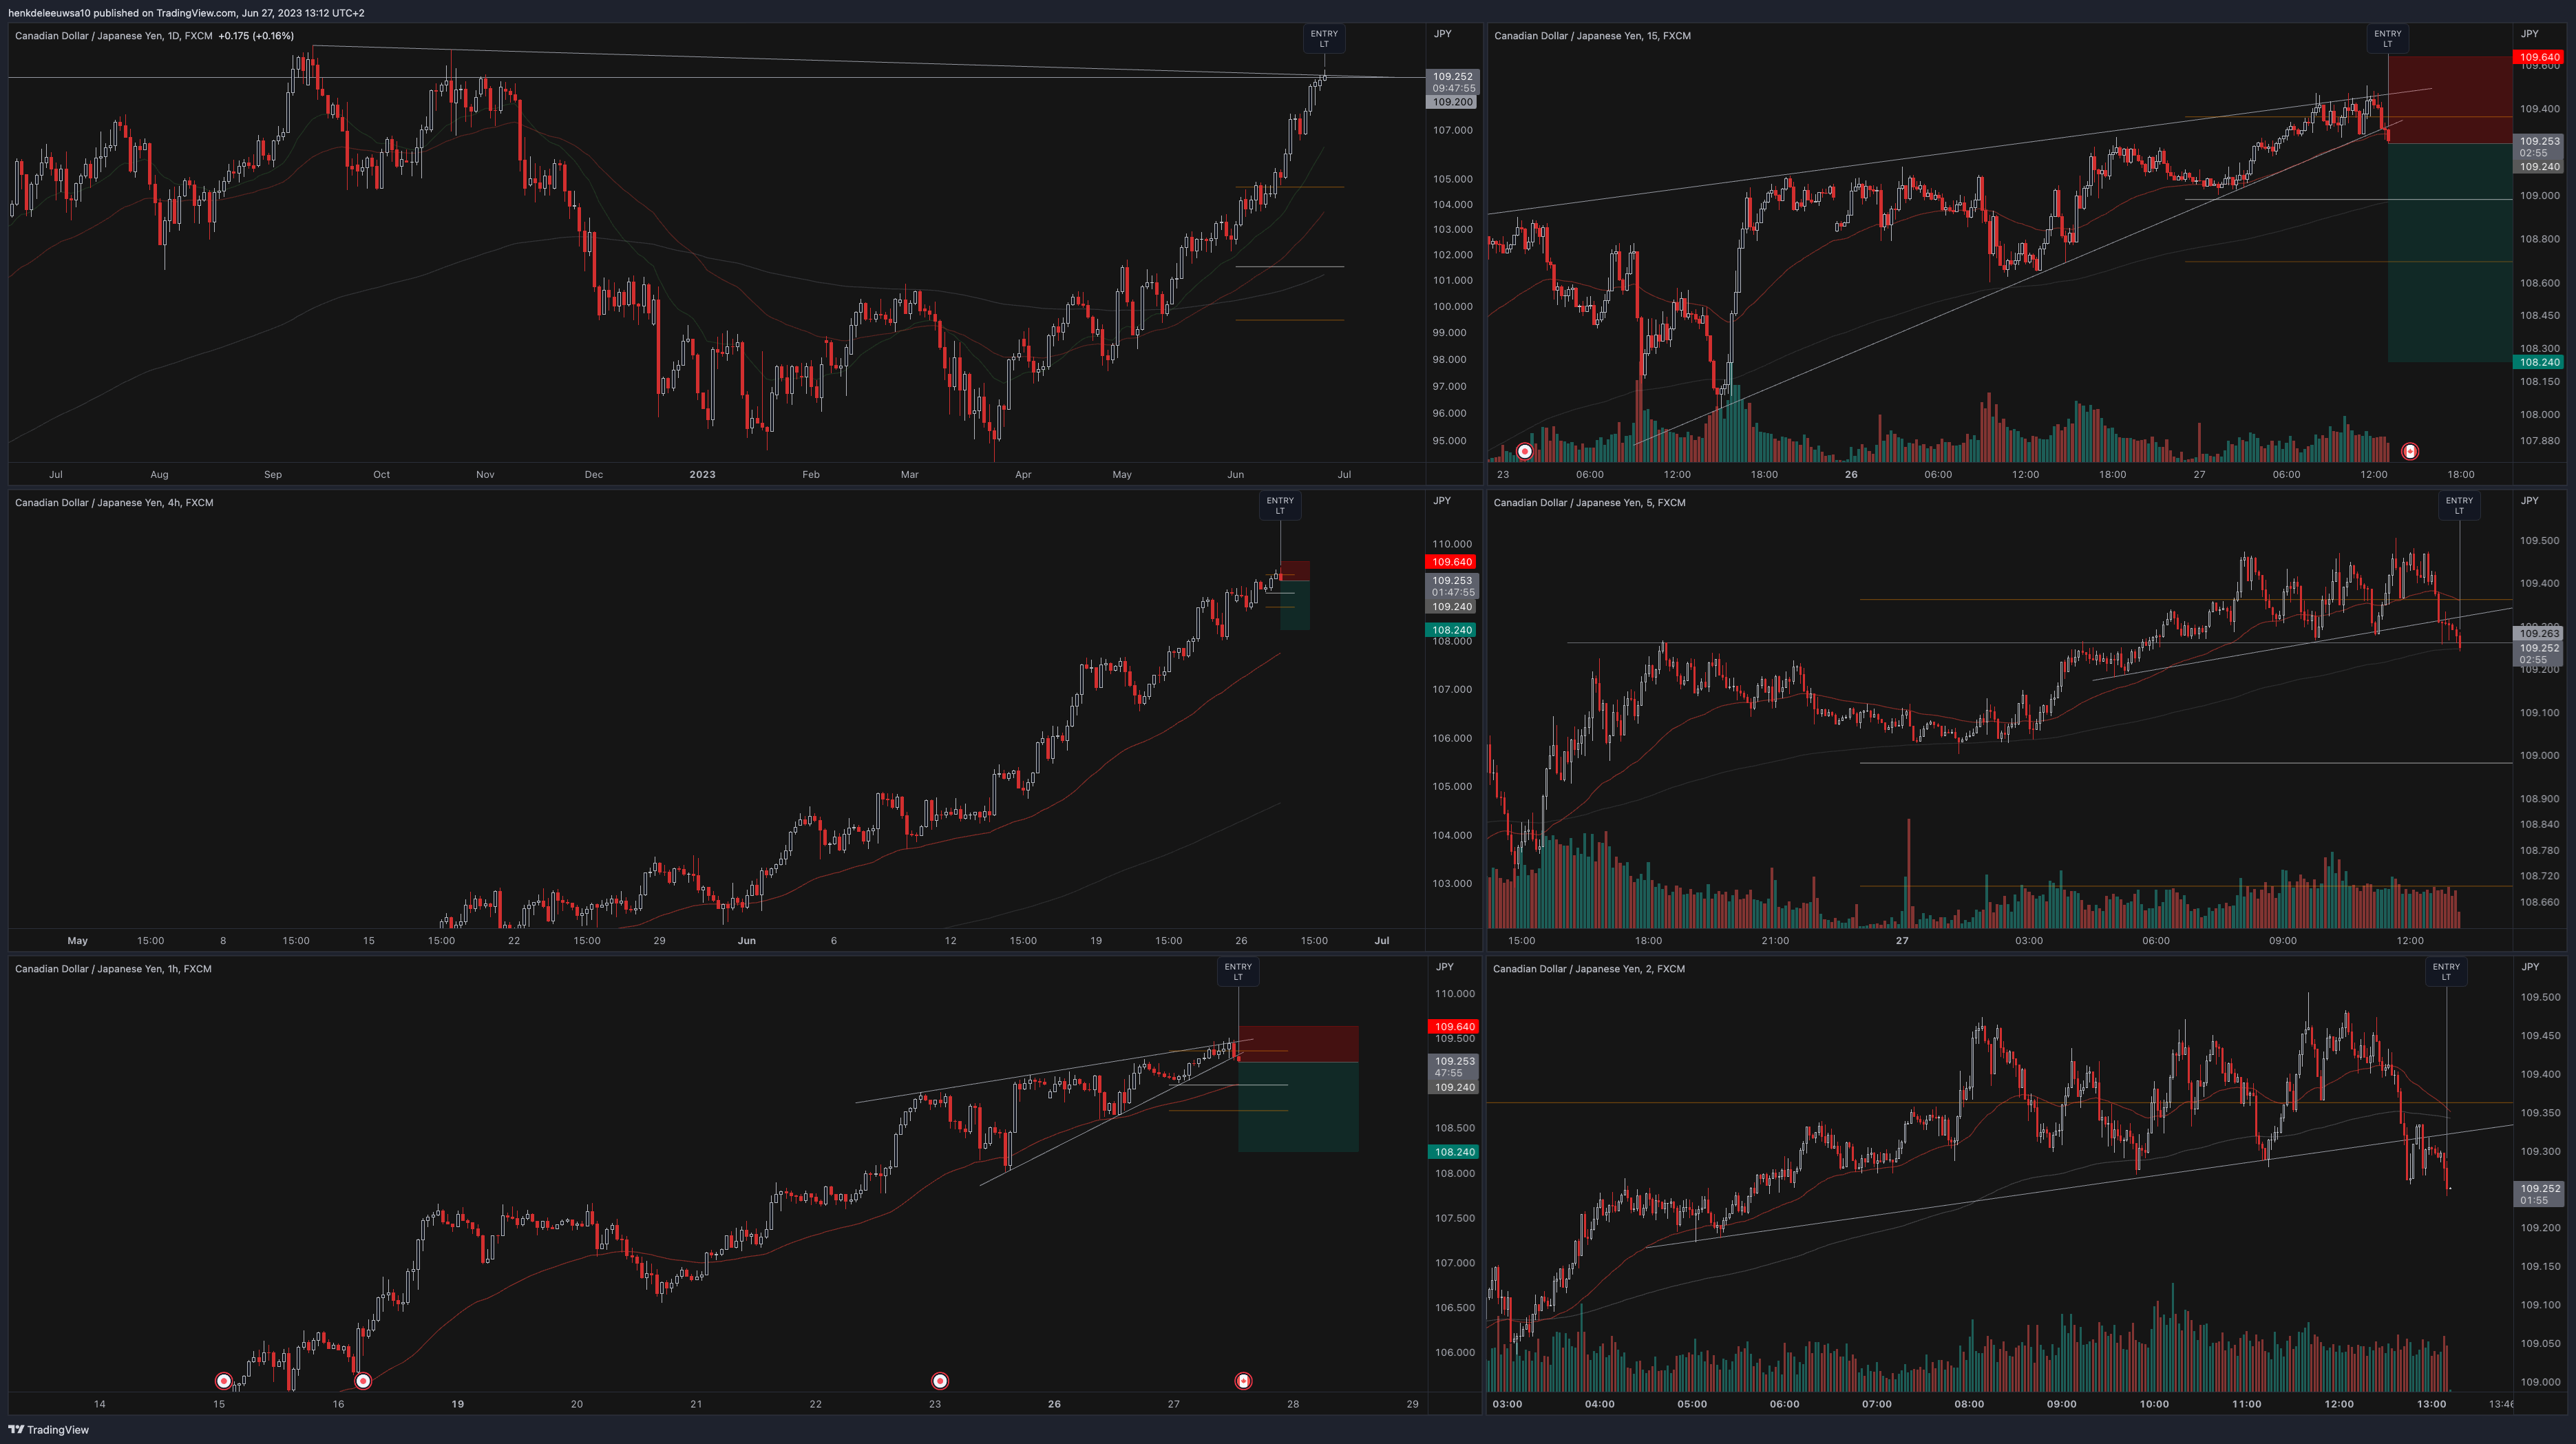 1 / 6
1 / 6CADJPY S 27 JUN 2023 RB1
That was one lesson